In recent years, due to the increasing development of industrialization and urbanization, air quality has become an important topic of discussion by the public in many countries. There are many studies have been conducted to reveal different aspects and discover the normal patterns of air quality. However, since the air quality data has many different types with geo-based data, existing methods cannot analyze such data comprehensively to the public. In this case, we introduce a visual analysis system to assist people to better analyze and explore air quality data.
To run the source code, download the zip file provided in the link "Download Code". Save the code folder in your preferred directory.
1. Install the flask framework. (http://flask.pocoo.org)
2. cd into src
3. Run "python run.py"
4. Open a new window in Chrome or Firefox and navigate to http://127.0.0.1:5002/. Note that the web application only works in Chrome and Firefox. It does not work in any version of Safari.
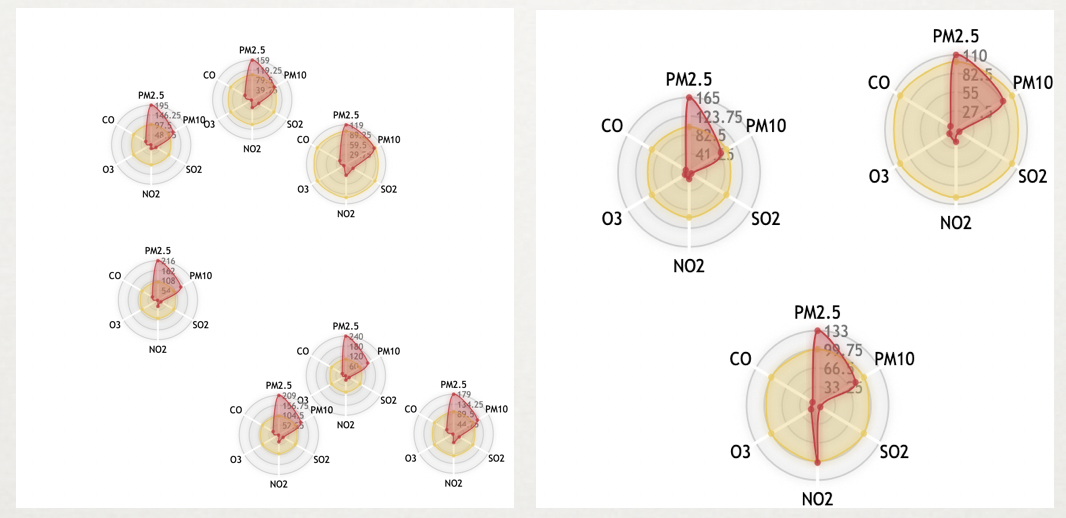
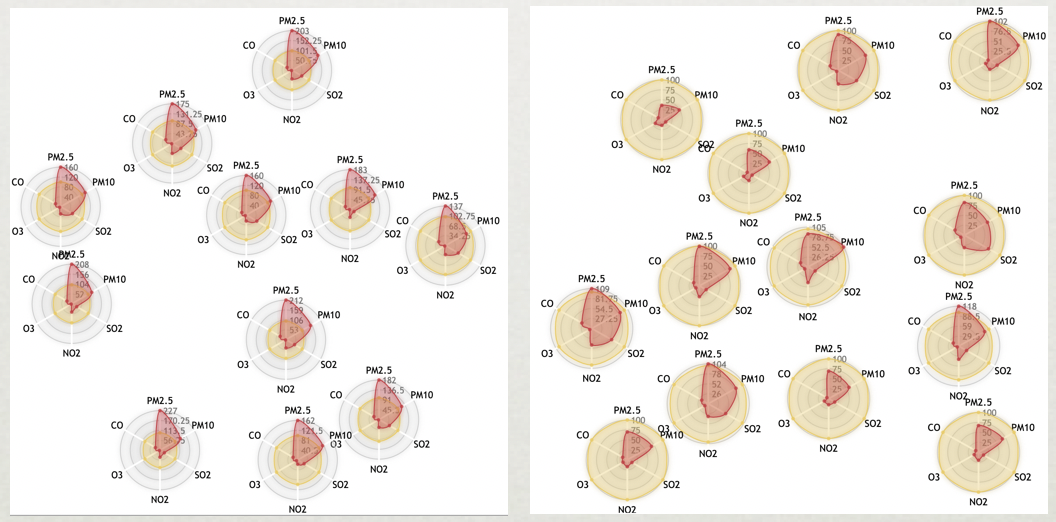
The images displayed below are produced by the web application.