Felipe Ardila (fardila@ucsc.edu)
CMP 261: Advanced Visualization (Winter 2019)
Visualizing Dark Matter Halo Merger Trees
Cosmological simulations allow us to recreate the evolution of the cosmic web
and better understand the dark matter halos that compose it. The direct output
of simulations is the positions of particles at various points in time. With
the particles we can determine the locations of halos and the history of
those halos through merger trees. Most visualizations of simulations focus on
3D rendering the particle data, with recent work producing highly interactive
tools to simultaneously explore different aspects of the particles, halos,
and merger trees. My project attempts to visualize dark matter halo trees in
novel ways. Three aproaches were taken: (1) visualizing the evolution of the
density profiles of halos over time, with the goal of better understanding
how they relate to the certain properties of the halo (e.g. mass, radius,
accretion rate), (2) using tree maps to visualize the hierarchical structure
of present day halos and all of their progenitors, and (3) using chord
diagrams to display the mergers of individual halos in a tree. Ultimately,
we wish to gain more intuition and provide a clearer picture of the physical
processes that dictate how halos evolve.

Standard visualization technique for dark matter simulations. This is an example
from the Illustris Simulation
1. Density Profiles
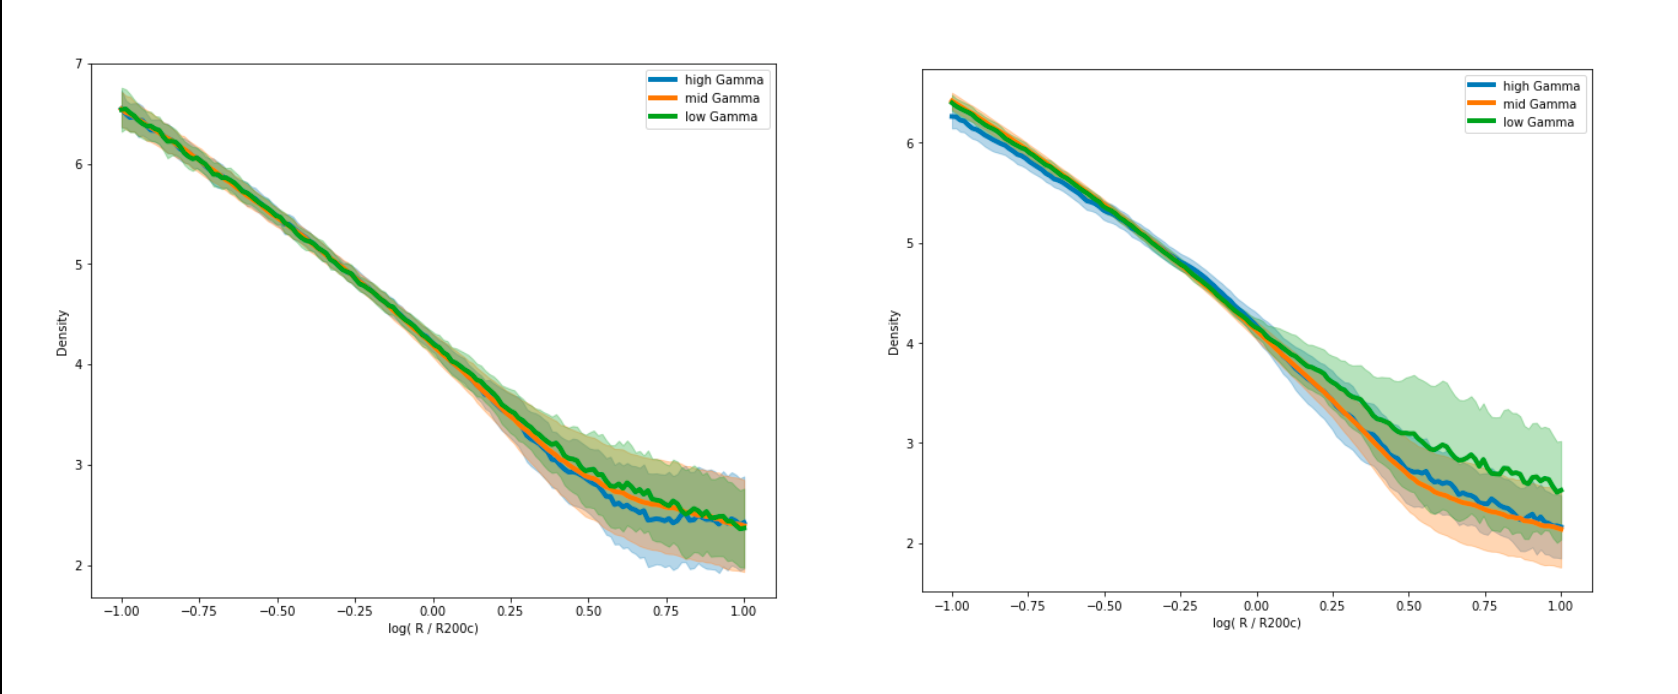
This visualization strategy did not work as originally planned. The data was
incomplete and there were matching issues. But we were able to at least plot
density profiles for halos of different accretion rates. The left shows an
earlier time (z=0.2) and the right is at the present day (z=0).
2. Tree Maps
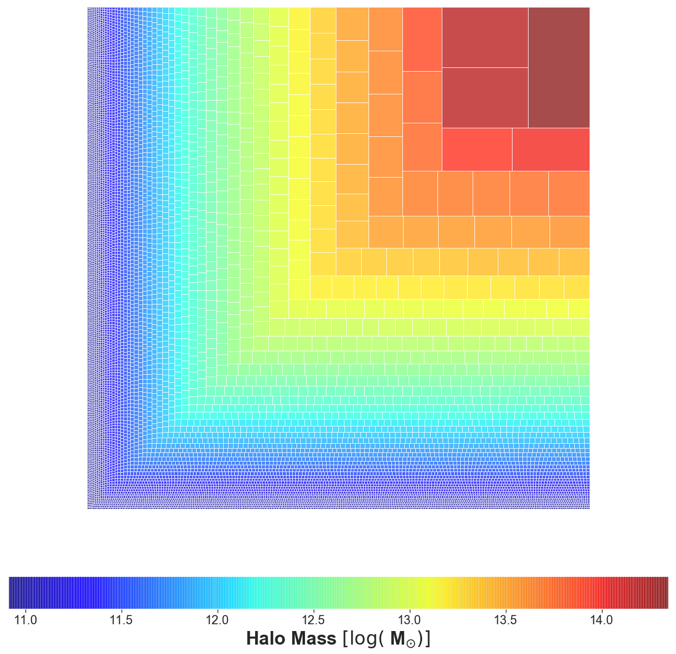
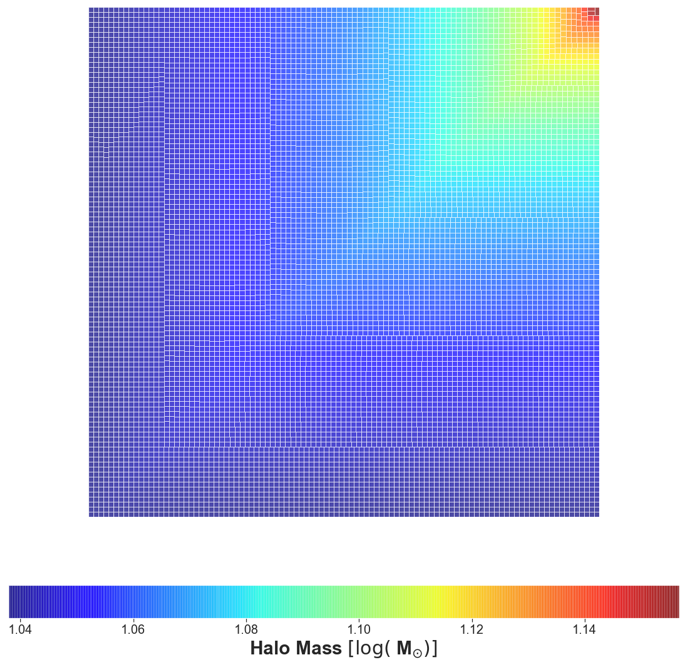
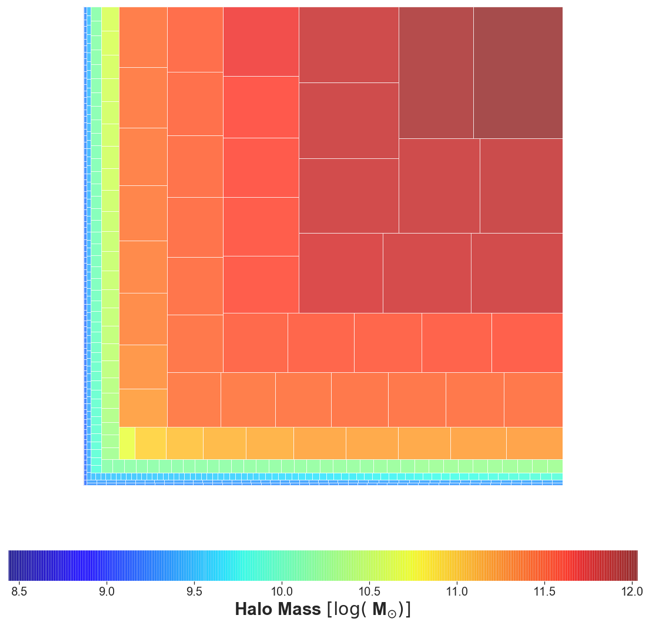
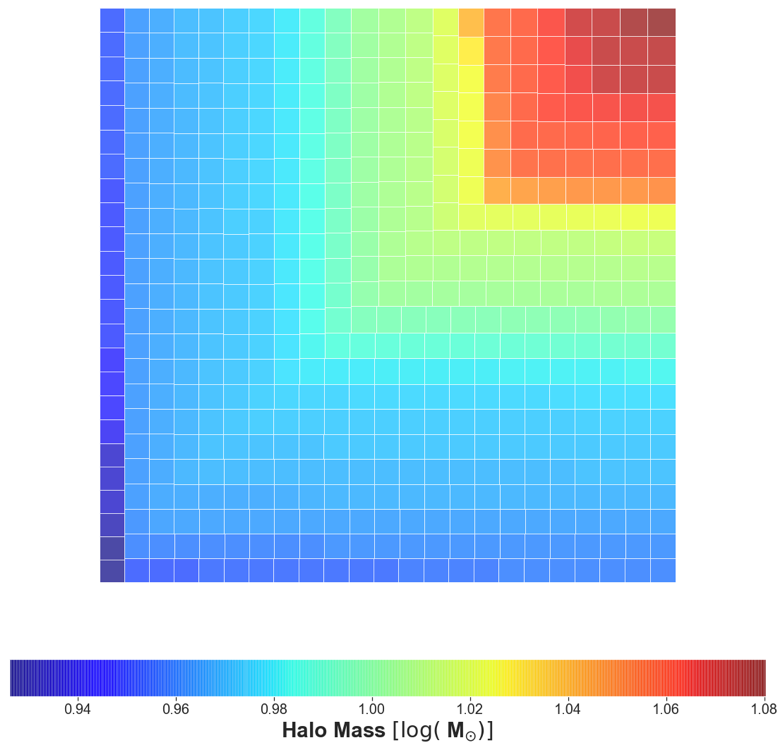
In the top row we show all of the halos at the present day, with color scaled to
halo mass. On the left size is scaled to halo mass as well, on the right it is
scaled to the logarithm of halo mass. Scaling to log allows us to more clearly
see the number of halos, while not doing so allows us to more clearly see the
distribution of masses. The bottom row shows a similar situation but for all of
the progenitors of a present day halo of mass 10^12 M_sun.
3. Chord Diagrams
.png)
.png)
.png)
.png)
Top row shows the chord diagram view for a the merger tree of a halo of mass
10^13 M_sun. Each node around the circle represents a halo which is a progenitor
of the present day halo. The node are sized and colored according to mass. On
the left the halos are ordered by mass as well. On the right they are ordered by
redshift. The bottom row shows the same views but for a less massive halo with a
sparser merger history.
#####################################################
For a more in depth discussion please see the complete write-up.
User Guide.
Source code.