Evan Olds - CMPS 261 - Winter 2019
Visualization of Memory Reuse in Immutable Stacks and Lists
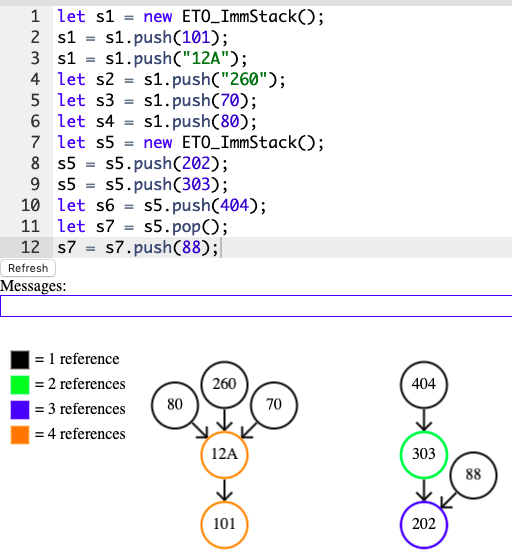
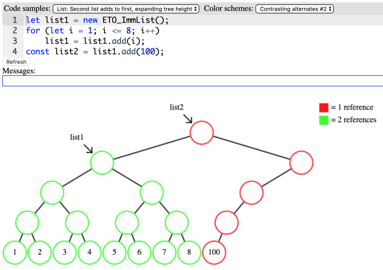
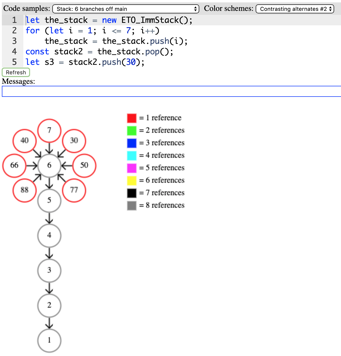
I propose a visualization tool designed specifically for two immutable data structures: an immutable stack using a singly-linked list and an immutable list using a binary tree. The visualization tool produces a rendering of nodes used by the data structures, along with color-coding to show memory reuse in the form of reference counts. After creating several stacks or lists from the same original source, many nodes have multiple references from different data structures. Higher reference counts are colored differently than lower reference counts, providing a quick visual illustration of the memory efficiency of the immutable data structures.
Project available online here
- Please read user's guide (below) first.
- Link opens in new tab/window.
- Project is 100% HTML and JavaScript. View source on the page to look at code.
Technical paper available here
Type JavaScript code in the code box at the top of the page. Construct one or more instances of ETO_ImmStack or ETO_ImmList. Ex:
let list1 = new ETO_ImmList();
list1 = list1.add(10);
list1 = list1.add(20);
let list2 = list1.add(30);
Construct only one of the two types, but as many of that type as you'd like. Hit the "Refresh" button to render the result.
A pulldown above the code lets you choose existing examples, which may help you to get a better idea.
A table summarizing ETO_ImmStack and ETO_ImmList class members, along with associated time complexities, is below.