Abstract
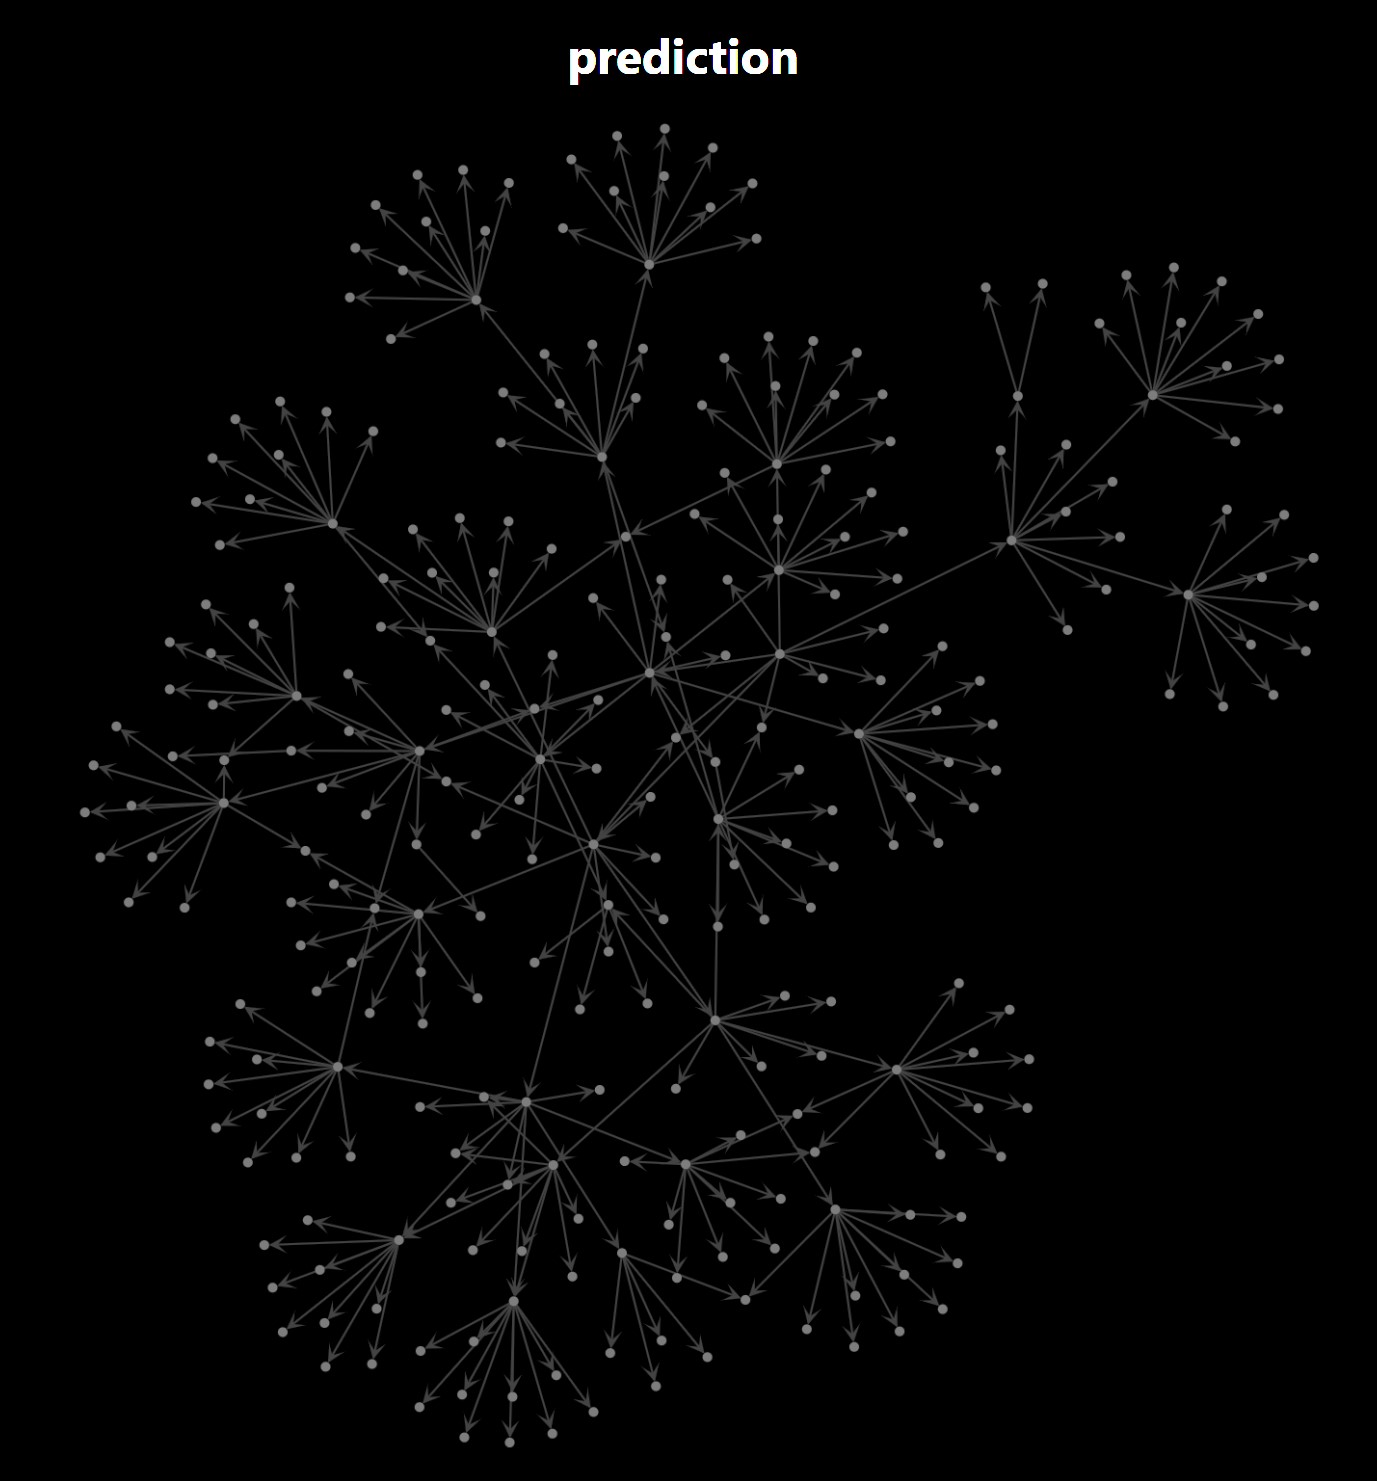
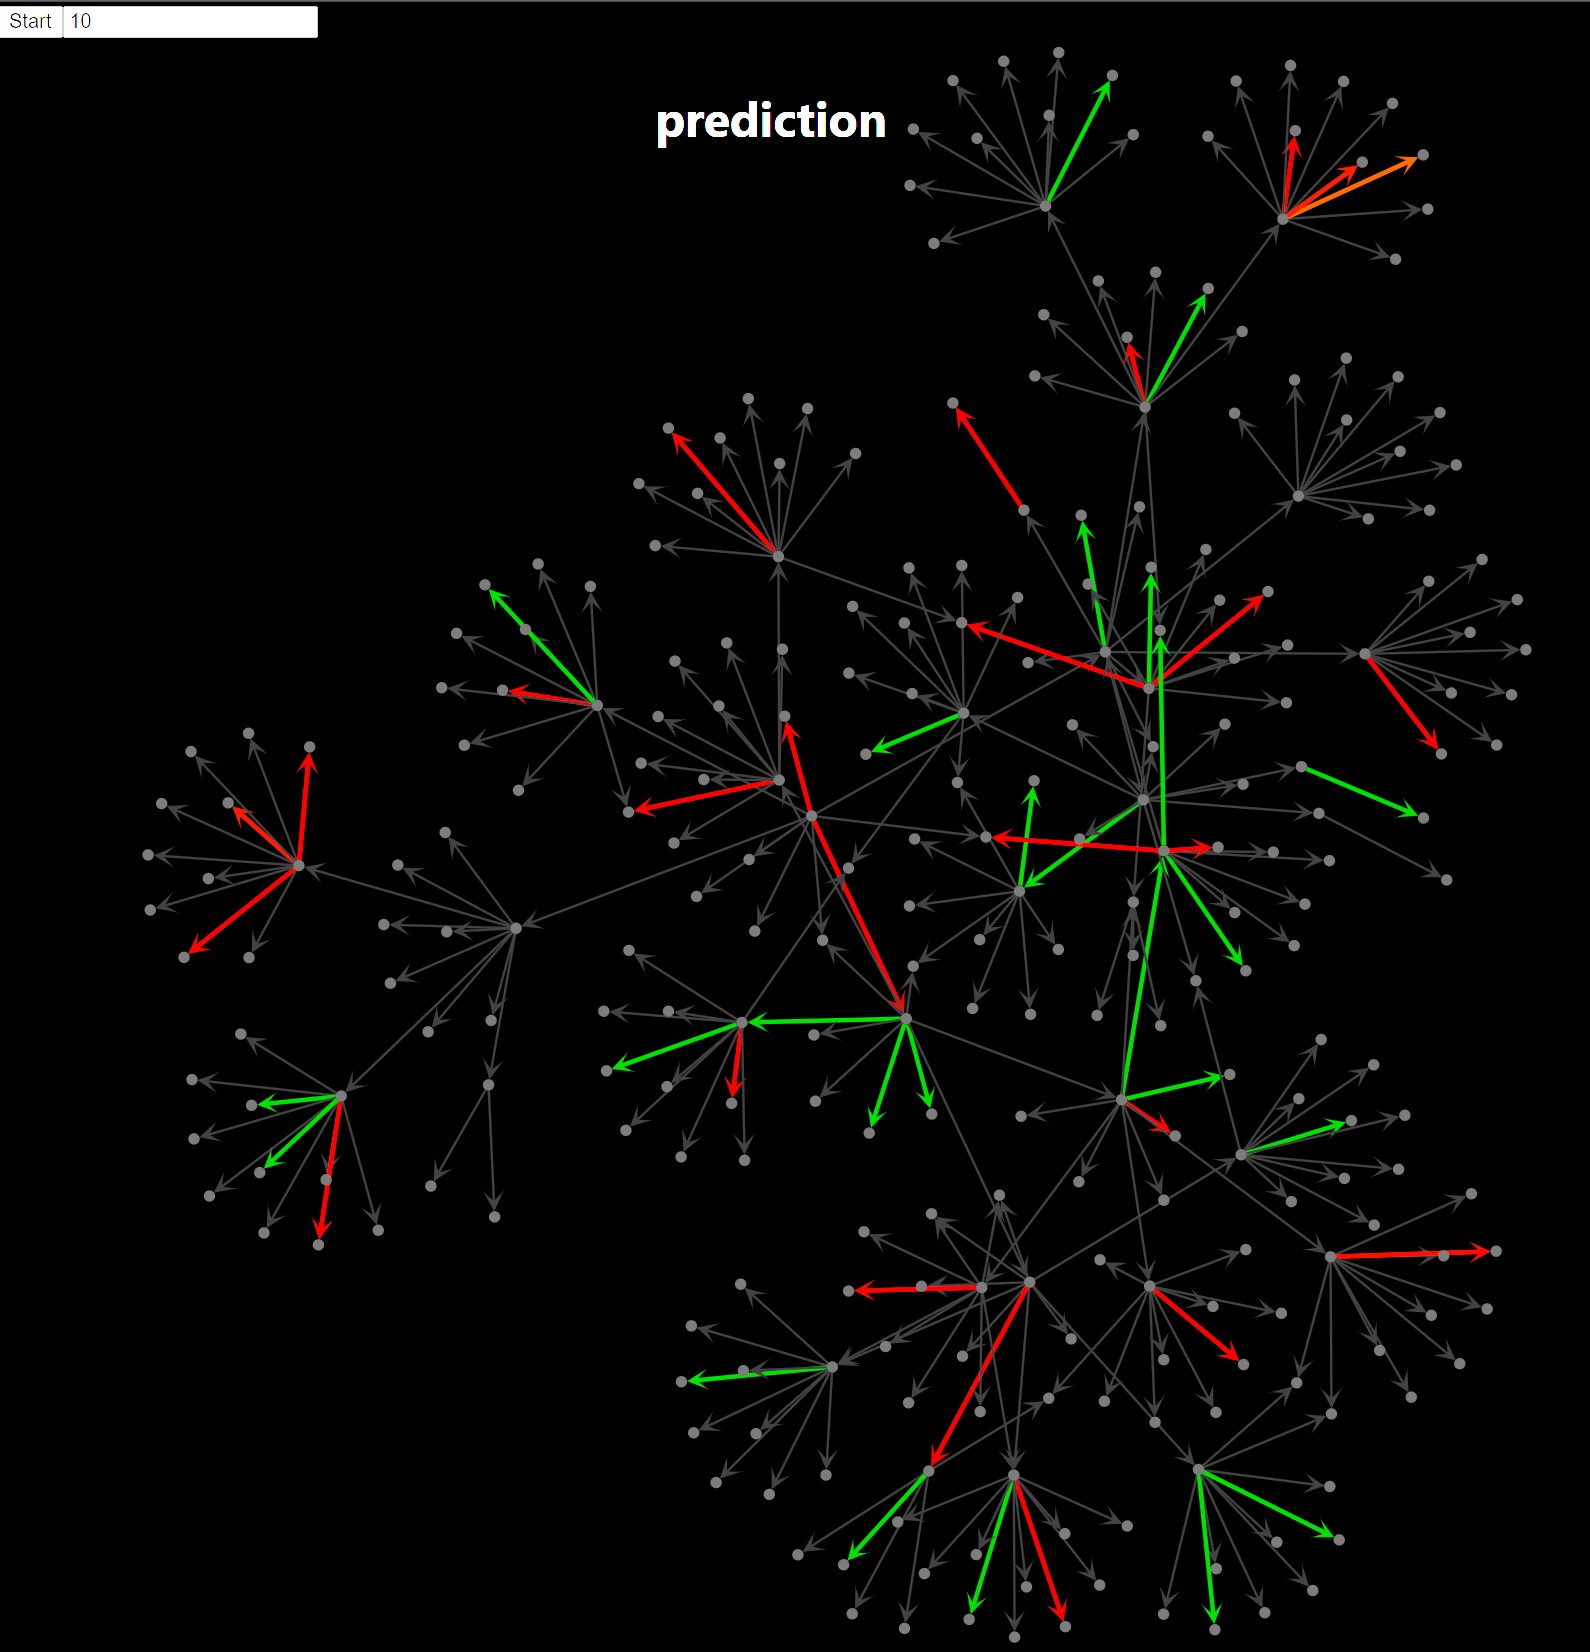
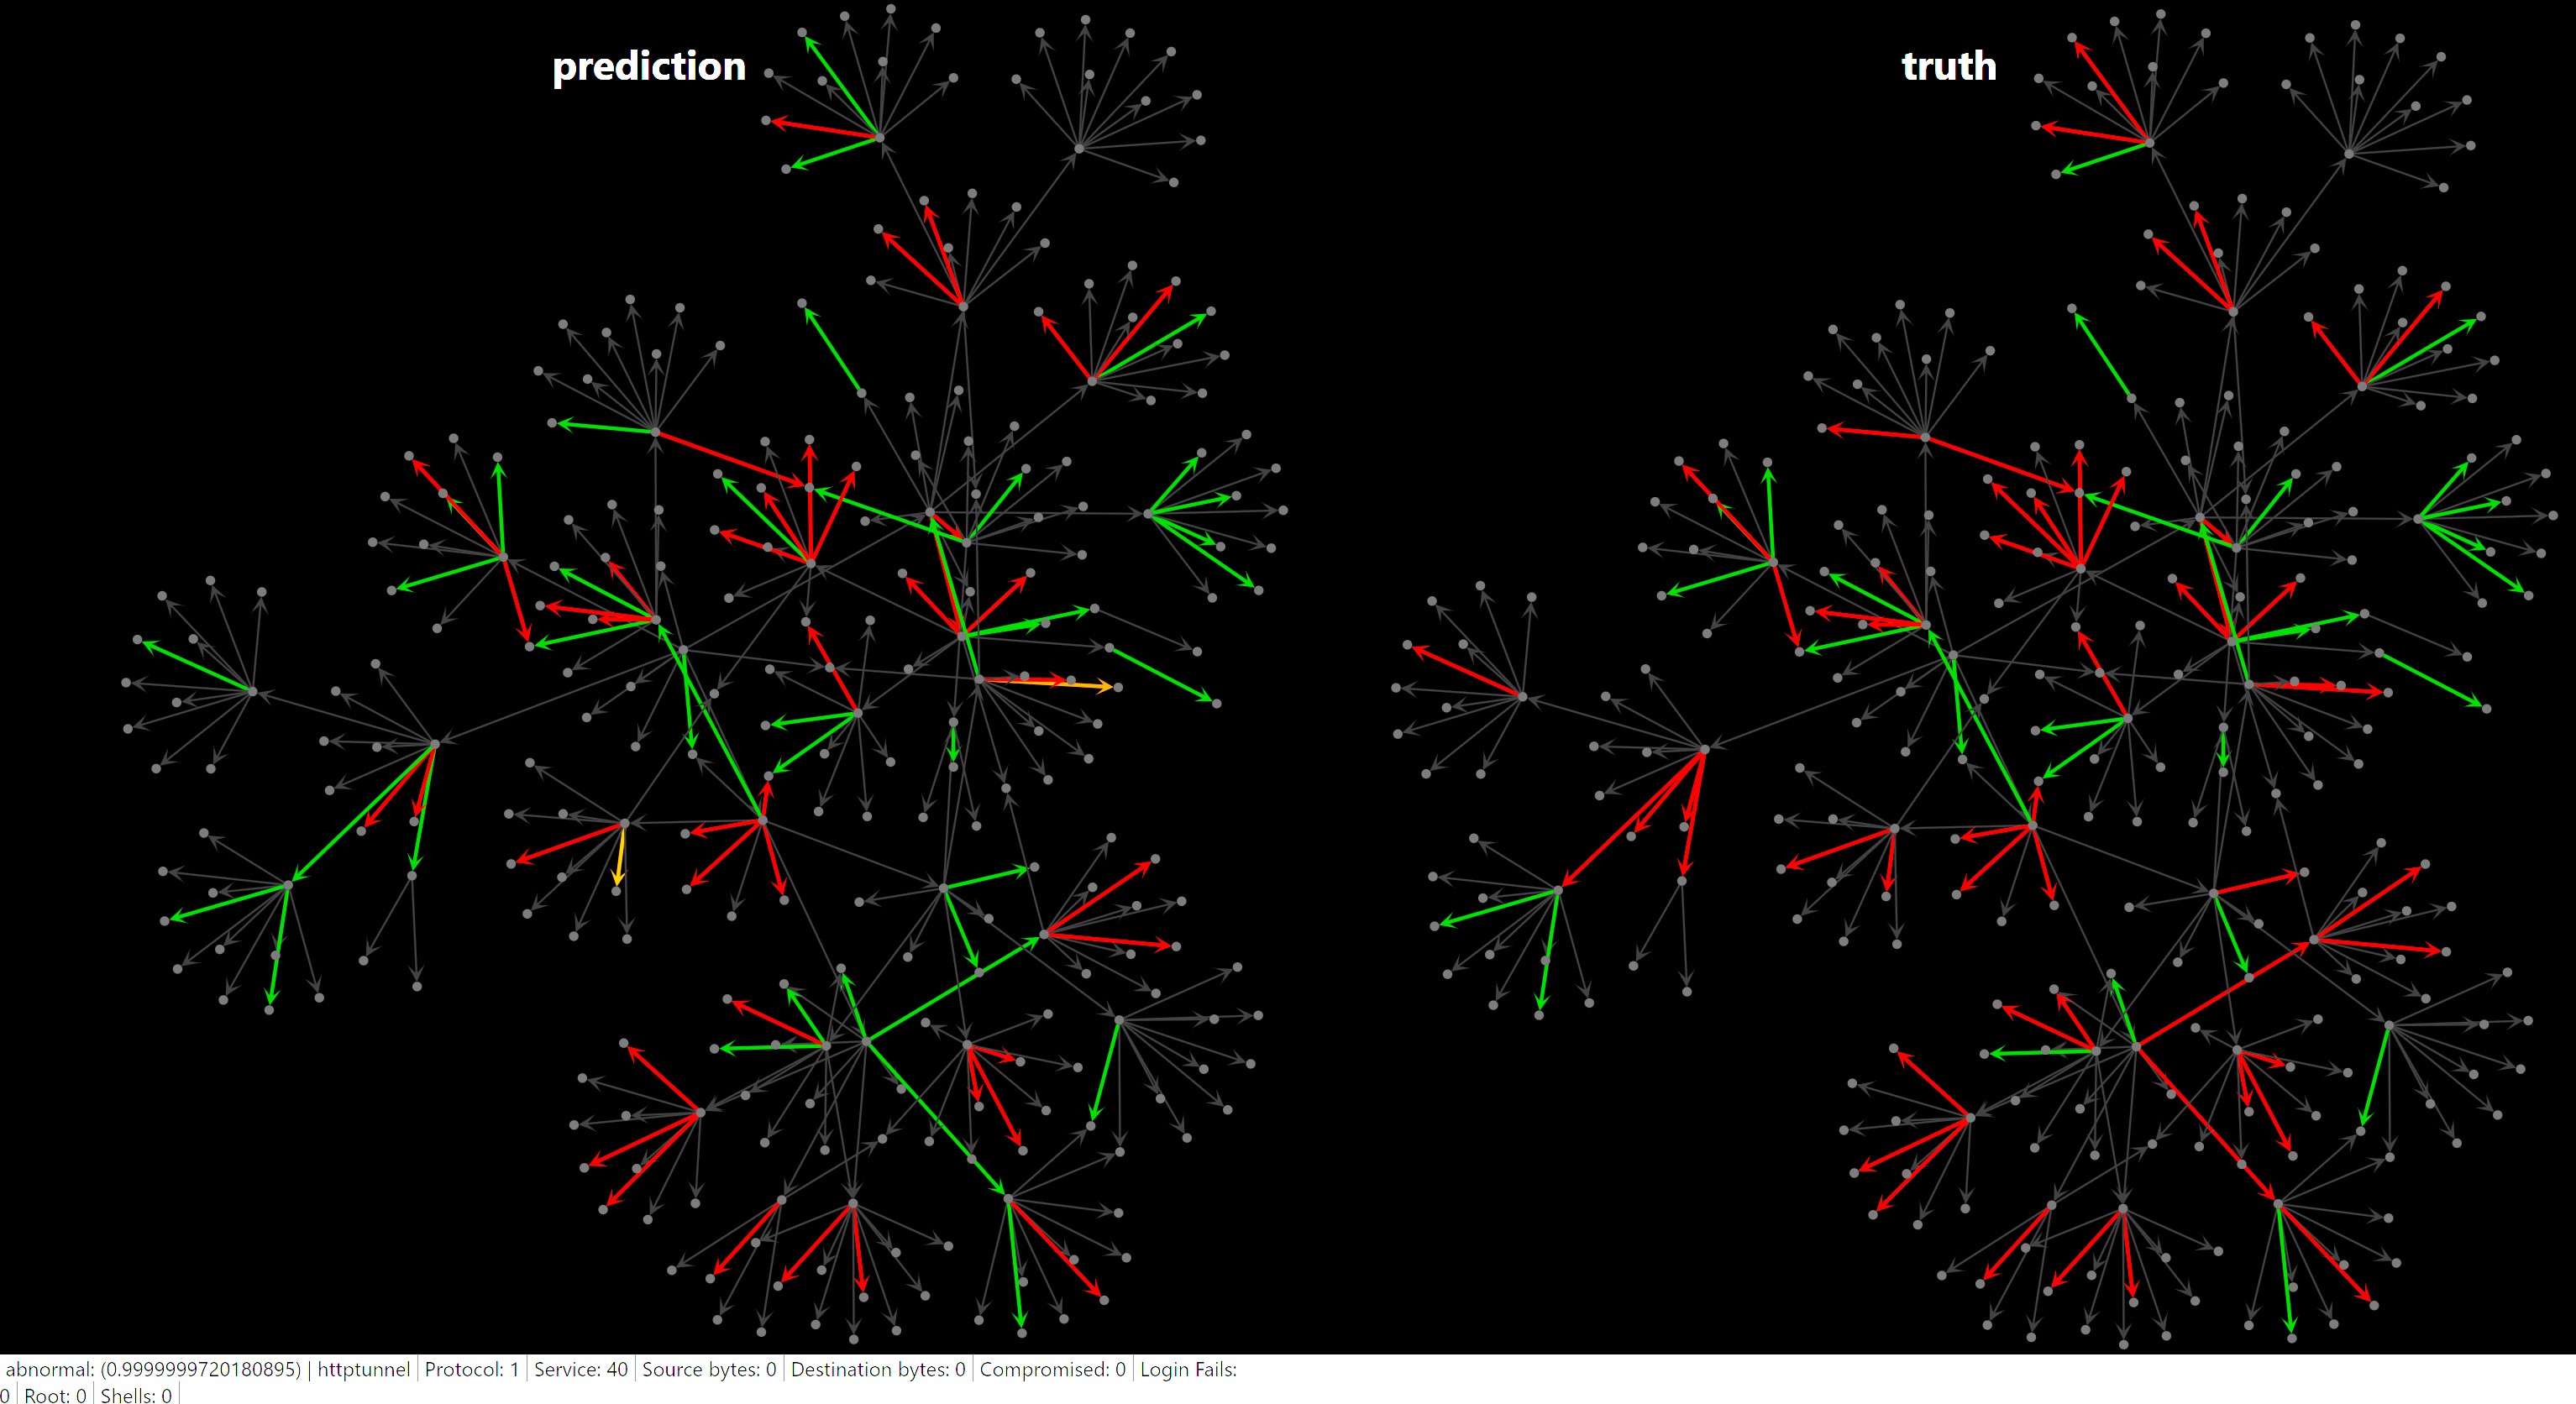
Deep neural networks have been used extensively to automatically detect network anomalies, assisting network administrators to deal with network failure and attack rapidly. LSTM is one of the most accurate DNN models for network anomaly detection. However, human intervention is needed after an anomaly emerges, so a interactive interface that incorporates network traffic data and anomaly records can support human to investigate the network according to the information give by the IDS. This paper propose an interactive system that visualize the network data along with the detected anomalies, providing an overview of the network and also drill-down views of network traffic information for human to locate, target and resolve problems more easily.
Resources
Project Images