AR UCSC :: Final Project
By Jonathan Chuang (jrchuang) for CMPS 161.
Source Download Technical Writeup Project Video
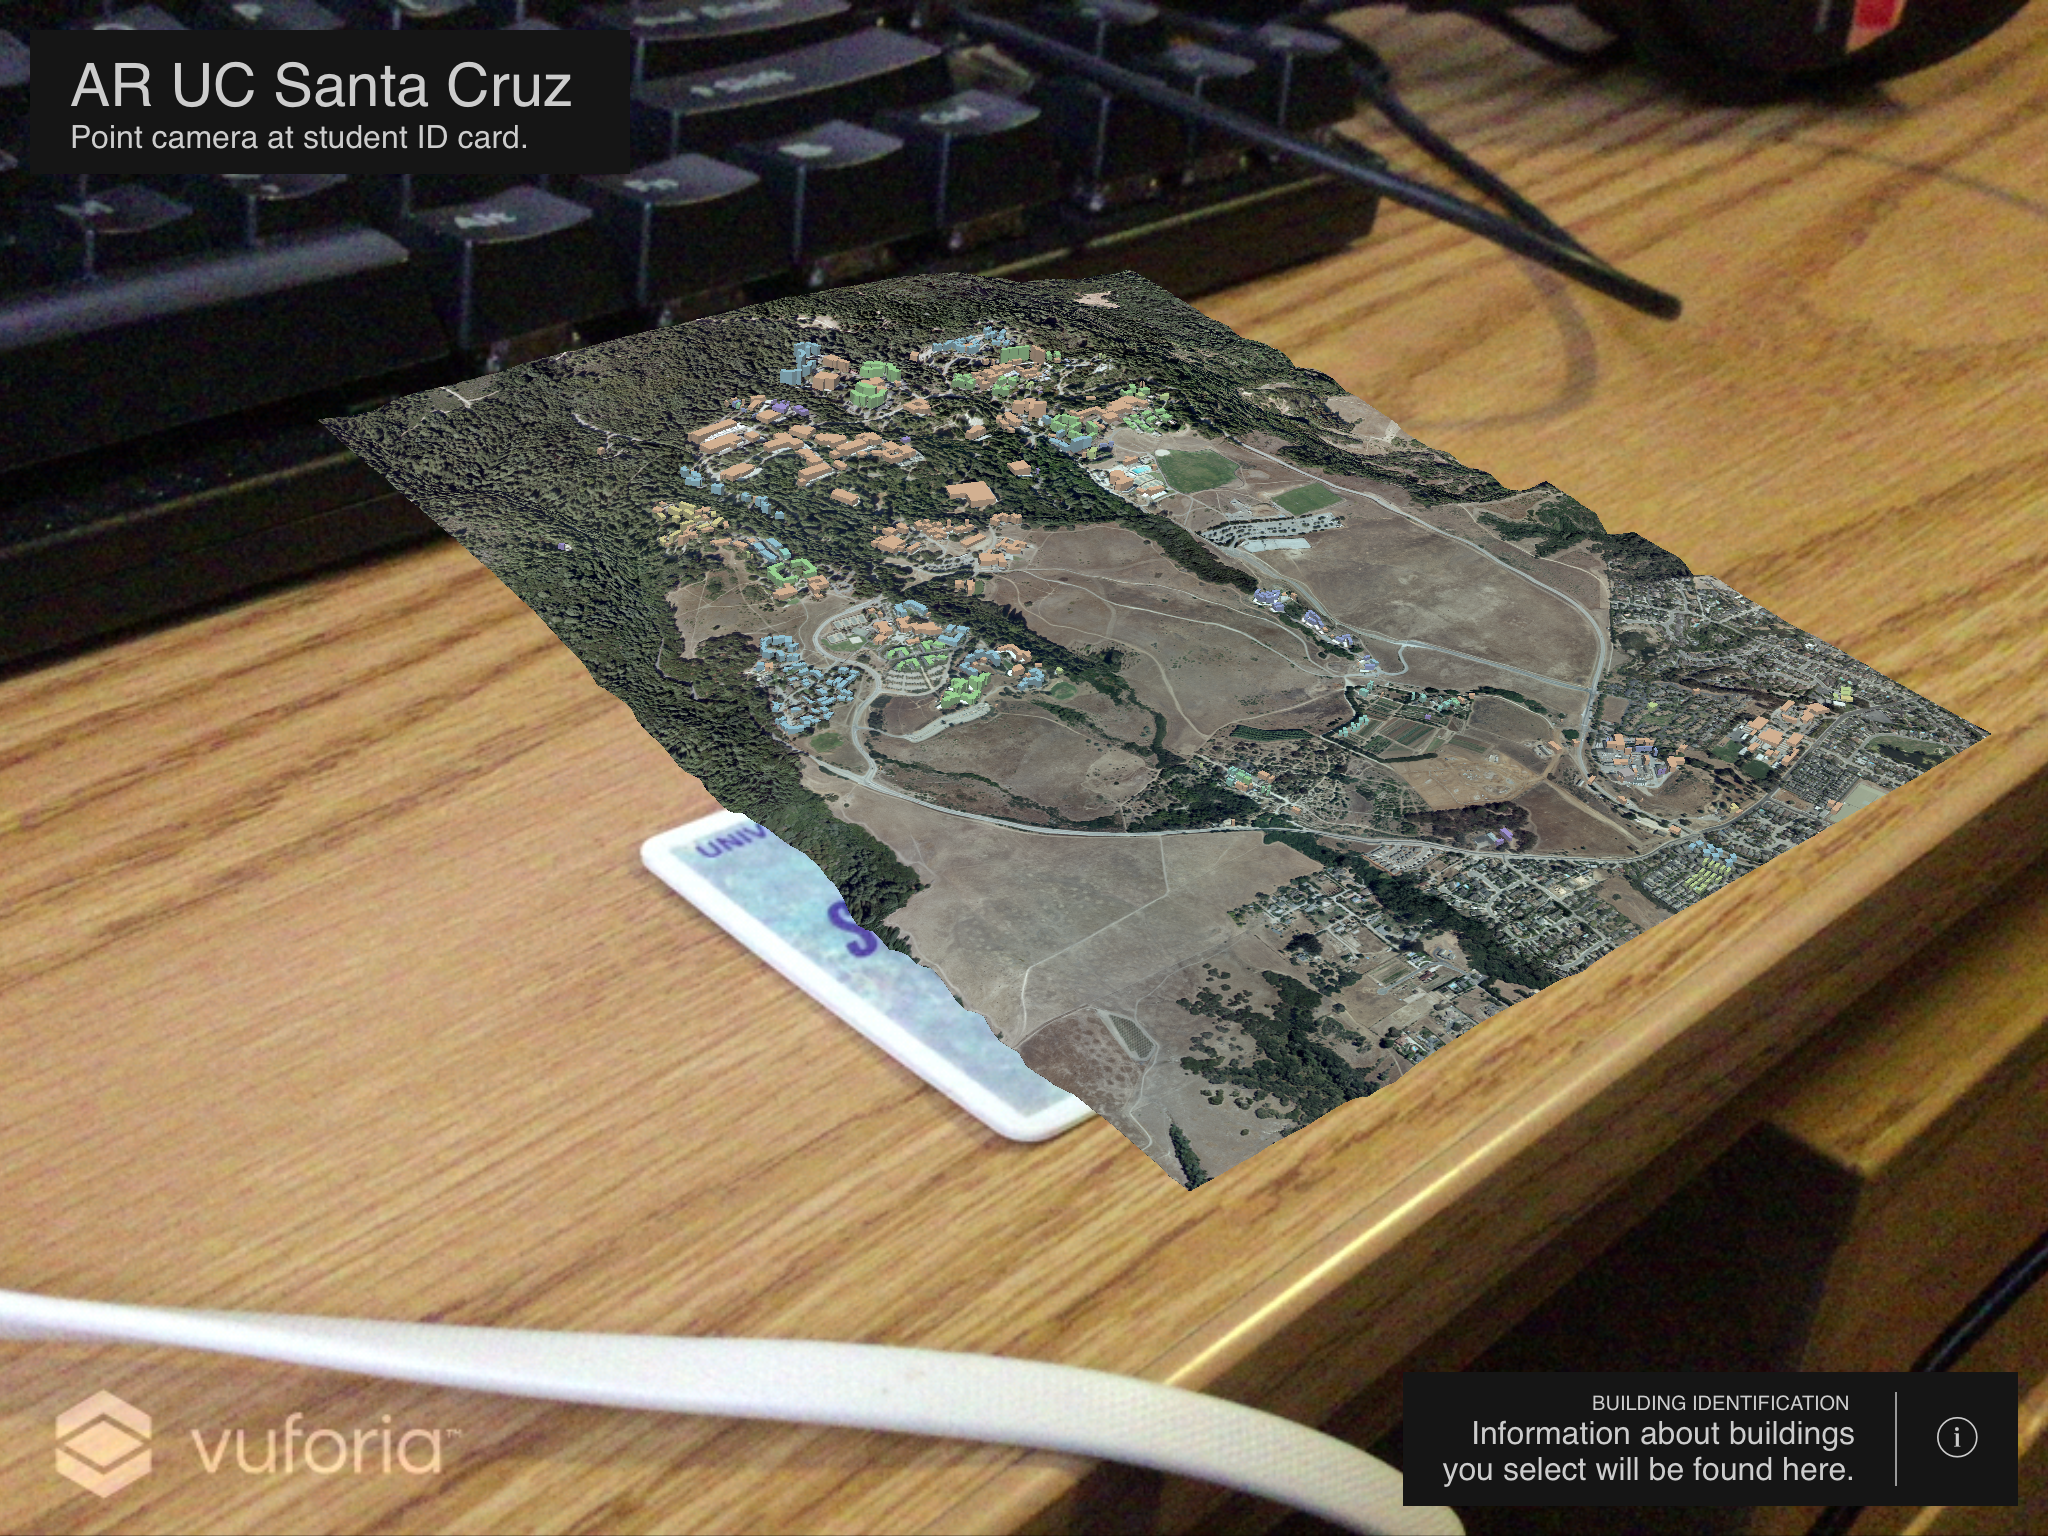
AR-based iOS application offering users an interactive 3D navigation map of UC Santa Cruz.
This project seeks out to implement an AR mobile application that renders a 3D model of the University of California Santa Cruz campus and immediate vicinity. It is intended as a utility for tracking the UC Santa Cruz campus, allowing any student to identify their relative location in 3D space with neighboring landmarks.
Five major components make up the project:
-
Design 1 :: AR
- AR-based iOS application offering users an interactive 3D navigation map of UC Santa Cruz. Heavily reliant on PTC Inc.’s Vuforia as a platform. Most data work completed in node.js making use of many of the open-source tools available on npm.
-
Design 2 :: Terrain
- USGS National Elevation Dataset (NED) 3D Elevation Program (3DEP) 1/9 arcsecond digital elevation model (DEM). Merged two tiles formatted in Erdas Imagine. Parsed using node-gdal, nodejs bindings for OSGeo’s Geospatial Data Abstraction Library to read heightmap and generate mesh. Normals are also computed. Arcseconds approximated to meters for consistency. Converted to Wavefront OBJ format, parsed in iOS using Nick Lockwood’s GLView utilities to circumvent Xcode limitations.
-
Design 3 :: Imagery
- Aerial data rejected due to skew. Satellite data. Landsat 7/8 (NASA/USGS) from USGS Sentinel 2 (ESA) from AWS Public Datasets Found most recent tile with minimal (<1%) cloud cover. Formatted in JPEG2000, 12 bands. Merged RGB bands and masked latitude and longitude using Sentinel Application Platform (SNAP). White balancing, curve adjustments, and other edits done in Photoshop for a more “natural” color. Went back for high resolution aerial orthoimagery. Used sharps/libvips and PhotoScape to merge and crop 24 12000x8000 TIF images. Edited to fit a 2^n texture for OpenGL ES 2.0.
-
Design 4 :: Architecture
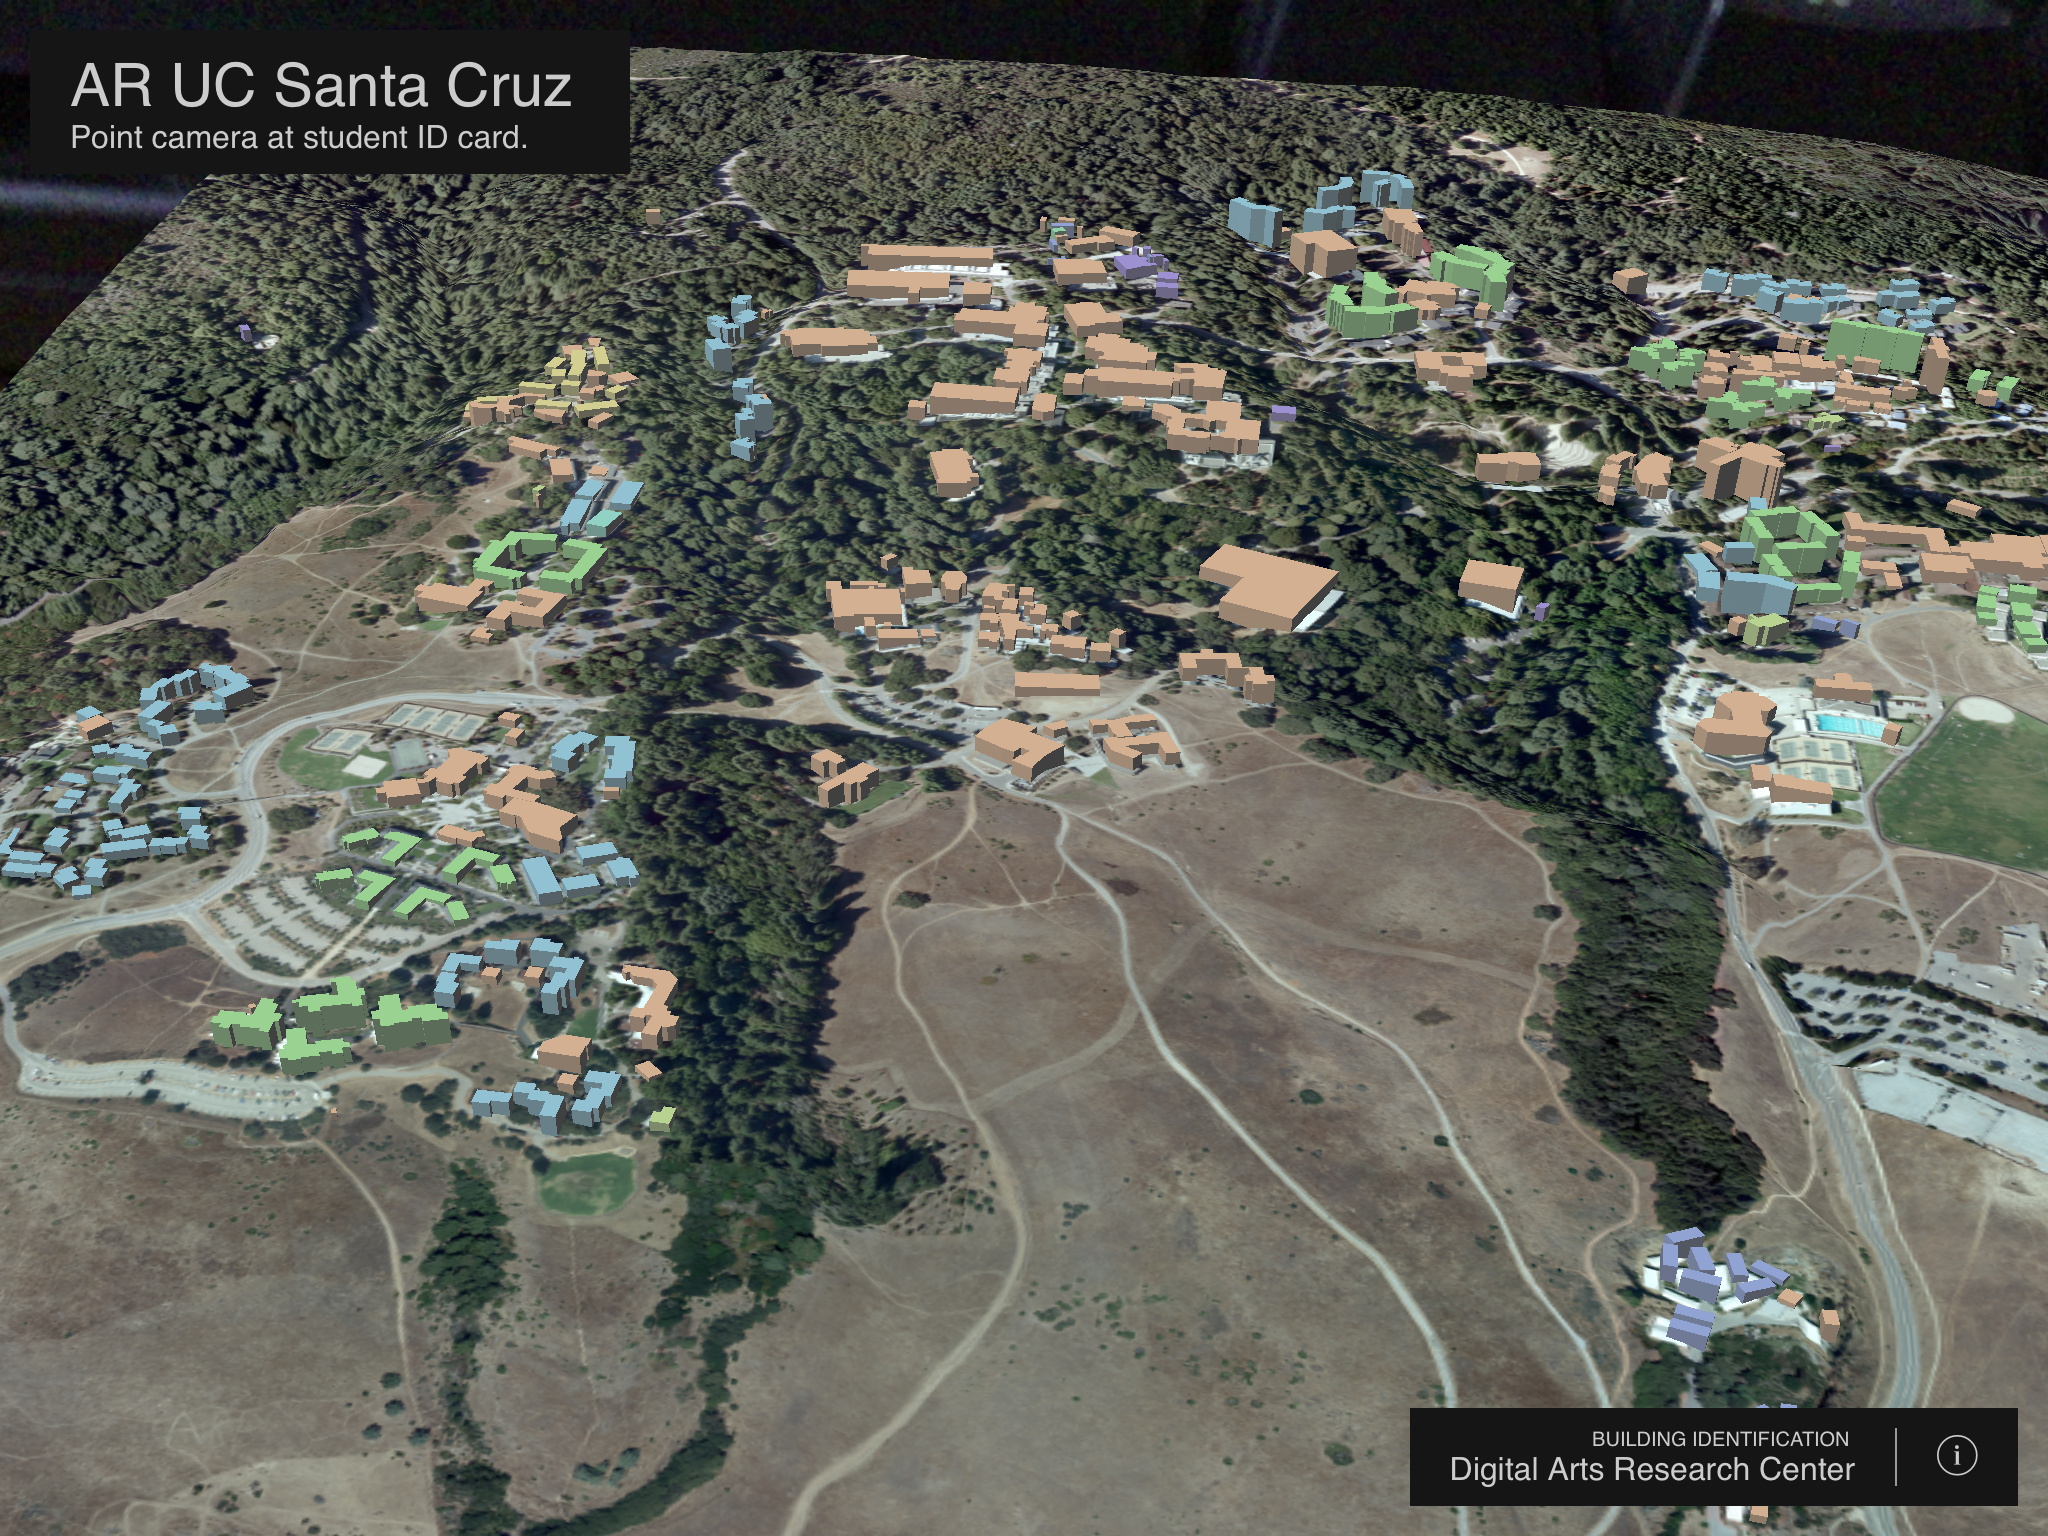
- OpenStreetMaps Buildings API. XML formatted. Contributers: Peter McMillan, director at UCSC IT, Steve All, Lisa Ramie, others. Parsed using xml2js. Latitude/longitude used. Roofs uses Mapbox’s earcut library, which uses Fast Industrial-Strength Triangulation of Polygons (FIST), ear clipping techniques, and Z-order curves. Flat top. Walls use surveyor’s formula/shoelace formula/Gauss’s area formula to determine orientation for normal calculation. Extends to land mesh. Lighting uses directional lighting and Gouraud shading.
-
Design 5 :: Identification
- Building identification by selection Building ID buffered as texCoords, read pixel color on an offscreen render on a secondary framebuffer. Uses web for UI and JSON as a reference table.
The project was completed over the span of approximately five weeks from Feb. to Mar. of 2017.
| # | Week | Completed Task |
|---|---|---|
| 1 | 1-2 | Acquired and processed datasets into iOS readable format. |
| 2 | 3 | Rendered terrain, textured in 3D. Tracked targets in 3D. |
| 2 | 4 | Tracked student ID in 3D. Rendered buildings. |
| 3 | 5 | Completed interactive elements and integrating UI via WebView. |
Resources Utilized:
- EarthExplorer, a terrific source for relevant elevation and imagery data.
- National Elevation Data, the USGS source for "raster elevation data of the conterminous United States".
- Sentinel 2 on AWS, Amazon Cloud Services offering satellite imagery from a recent source conveniently.
- Airbus Defense and Space, potentially a low cost source for imagery.
- DigitalGlobe, a more expensive source for commercial satellite imagery.
- An excellent article posted on NASA.gov about how to process the free Landsat 8 satellite imagery.
- OpenStreetMaps Buildings, their Wiki page describing information about their building data.
- A Mapbox article describing techniques that can be implemented when mapping OpenStreetMaps 3D building data.
- Vuforia Developer Portal, offering all the documentation requisite to get started using AR with Vuforia