


Next: A Computational Screen for Yeast.2
Up: Analysis of the Genomic
Previous: A tRNA-derived SINE
In conclusion, our study of the complete C. elegans tRNA family has produced
several new observations. First, the Guthrie revised wobble rules
[Guthrie & Abelson, 1982] appear to apply well to C. elegans. In the absence of
biochemical data on anticodon modifications, we are now able to infer
C. elegans tRNAs contain modifications that are typical within Eukarya based
on family representation. Second, tRNA genome copy number correlates
well with codon usage. Based on highly-expressed genes' codon
preference for the most redundant tRNA species, we also infer that
tRNA copy number is a major determinant of intracellular tRNA
concentration. Finally, there appears to be a great diversity of
tRNA-like pseudogenes within the C. elegans genome. We identify and
partially classify over 200 of these elements, in contrast to the
single tRNA pseudogene found in the S. cerevisiae genome [Lowe & Eddy, 1997]. We
also present what we believe is the first example of a retrotransposon
SINE repetitive element in C. elegans. The study of
pseudogenes and repetitive elements in metazoans will no doubt be a
rich area of genome research in the future, as they are molecular
fossils that may give new clues regarding genome dynamics and
evolution. The opportunity to study complete gene families, including
pseudogenes, is one of the unique benefits yielded by the current
``genome rush''.
Table 3.3:
Four-box tRNA Families in C. elegans. tRNAs were
named and numbered based on predicted isotype and frequency rank
within genome. ``Codon'' entries are grouped with the major
tRNA-decoding species based on standard ``wobble'' rules
[Crick, 1966]. ``tDNA Anticodon'' inferred from tRNAscan-SE
[Lowe & Eddy, 1997] analysis. Experimental tRNA anticodon modification data
is available only for Leu-1 [Tranquilla et al., 1982]; the only
modifications assumed for ``tRNA Anticodon''s are the common
first-position adenosine to inosine (I) conversions. Pseudogenes
recognizably derived from ``legitimate'' tRNA species are included in
``Genomic Copies'' as ``p'' counts. ``Codon frequency'' is the number
of codons per thousand total codons.
Isotype |
Codon |
tRNA |
tDNA |
tRNA |
Genomic |
Codon |
Pref by Highly |
Notes |
| |
|
|
Anticodon |
Anticodon |
Copies |
Frequency |
Expr. Genes |
|
Ala |
GCU |
Ala-1 |
AGC |
IGC |
22 |
22.4 |
* |
|
| |
GCC |
|
|
|
|
11.9 |
* |
|
| |
GCA |
Ala-2 |
TGC |
UGC |
8 |
20.1 |
|
|
| |
GCG |
Ala-3 |
CGC |
CGC |
4 |
7.8 |
|
|
Gly |
GGA |
Gly-1 |
TCC |
UCC |
31 + 1p |
31.4 |
* |
|
| |
GGC |
Gly-2 |
GCC |
GCC |
13 |
6.4 |
|
|
| |
GGU |
|
|
|
|
11.0 |
|
|
| |
GGG |
Gly-3 |
CCC |
CCC |
3 |
4.4 |
|
|
Pro |
CCA |
Pro-1 |
TGA |
UGA |
32 + 3p |
25.9 |
* |
|
| |
CCU |
Pro-2 |
AGG |
IGG |
6 |
9.1 |
|
|
| |
CCC |
|
|
|
|
4.4 |
|
|
| |
CCG |
Pro-3 |
CGG |
CGG |
4 |
9.0 |
|
|
Thr |
ACU |
Thr-1 |
AGT |
IGU |
17 |
19.5 |
|
|
| |
ACC |
|
|
|
|
10.3 |
* |
|
| |
ACA |
Thr-2 |
TGT |
UGU |
12 |
20.3 |
|
3 w/intr |
| |
ACG |
Thr-3 |
CGT |
CGU |
7 + 1p |
8.5 |
|
|
Val |
GUU |
Val-1 |
AAC |
IAC |
18 |
24.8 |
|
|
| |
GUC |
|
|
|
|
13.2 |
* |
|
| |
GUA |
Val-2 |
TAC |
UAC |
5 |
10.3 |
|
|
| |
GUG |
Val-3 |
CAC |
CAC |
5 |
14.1 |
|
|
|
Table 3.4:
Non four-box tRNA Families in C. elegans.
See Table 3.3 for column headings.
|
Isotype |
Codon |
tRNA |
tDNA |
tRNA |
Genomic |
Codon |
Pref by Highly |
Notes |
| |
|
|
Anticodon |
Anticodon |
Copies |
Frequency |
Expr. Genes |
|
| Arg |
CGU |
Arg-1 |
ACG |
ICG |
19 + 2p |
11.0 |
* |
|
| |
CGC |
|
|
|
|
4.9 |
* |
|
| |
CGA |
Arg-2 |
TCG |
UCG |
10 |
11.6 |
|
|
| |
CGG |
Arg-3 |
CCG |
CCG |
1 |
4.4 |
|
|
| |
AGA |
Arg-4 |
TCT |
UCU |
7 + 1p |
15.6 |
|
|
| |
AGG |
Arg-5 |
CCT |
CCU |
4 |
3.8 |
|
|
| Ser |
AGC |
Ser-4 |
GCT |
GCU |
8 + 1p |
8.1 |
|
|
| |
AGU |
|
|
|
|
12.3 |
|
|
| |
UCU |
Ser-1 |
AGA |
IAC |
15 |
17.3 |
* |
|
| |
UCC |
|
|
|
|
10.5 |
* |
|
| |
UCA |
Ser-2 |
TGA |
UGA |
7 |
20.7 |
|
|
| |
UCG |
Ser-3 |
CGA |
CGA |
6 |
11.5 |
|
|
Leu |
CUU |
Leu-1 |
AAG |
IAG |
19 + 2p |
21.6 |
* |
|
| |
CUC |
|
|
|
|
14.5 |
* |
|
| |
CUG |
Leu-2 |
CAG |
CAG |
6 |
11.8 |
|
|
| |
CUA |
Leu-3 |
TAG |
UAG |
3 |
8.1 |
|
|
| |
UUG |
Leu-4 |
CAA |
CAA |
7 |
20.4 |
|
7 w/intr |
| |
UUA |
Leu-5 |
TAA |
UAA |
4 |
10.5 |
|
|
| Phe |
UUC |
Phe-1 |
GAA |
GAA |
13 + 1p |
24.4 |
* |
|
| |
UUU |
|
|
|
|
25.3 |
|
|
Asp |
GAC |
Asp-1 |
GTC |
GUC |
27 + 2p |
16.7 |
* |
|
| |
GAU |
|
|
|
|
35.6 |
|
|
| Glu |
GAG |
Glu-1 |
CTC |
CUC |
23 |
23.2 |
* |
|
| |
GAA |
Glu-2 |
TTC |
UUC |
17 + 3p |
40.9 |
|
|
His |
CAC |
His-1 |
GTG |
GUG |
18 + 10p |
9.0 |
* |
|
| |
CAU |
|
|
|
|
14.2 |
|
|
| Gln |
CAA |
Gln-1 |
TTG |
UUG |
18 + 13p |
27.2 |
|
|
| |
CAG |
Gln-2 |
CTG |
CUG |
6 + 1p |
13.6 |
* |
|
Asn |
AAC |
Asn-1 |
GTT |
GUU |
20 + 1p |
18.7 |
* |
|
| |
AAU |
|
|
|
|
31.0 |
|
|
| Lys |
AAG |
Lys-1 |
CTT |
CUU |
31 |
25.5 |
* |
|
| |
AAA |
Lys-2 |
TTT |
UUU |
15 + 1p |
38.9 |
|
|
Met |
AUG |
Met-i |
CAT |
CAUi |
8 + 1p |
- |
|
|
| |
AUG |
Met-1 |
CAT |
CAU |
9 |
23.9 |
|
|
| Ile |
AUU |
Ile-1 |
AAT |
AAU |
21 + 1p |
33.4 |
|
|
| |
AUC |
|
|
|
|
18.9 |
* |
|
| |
AUA |
Ile-2 |
TAT |
UAU |
7 + 1p |
10.1 |
|
3 w/intr |
Cys |
UGC |
Cys-1 |
GCA |
GCA |
13 |
9.1 |
* |
|
| |
UGU |
|
|
|
|
11.6 |
|
|
| Trp |
UGG |
Trp-1 |
CCA |
CCA |
10 |
11.1 |
|
|
| SeC |
UGA |
SeC |
TCA |
UCA |
1 |
0.0 |
|
|
Tyr |
UAC |
Tyr-1 |
GTA |
GUA |
19 |
14.0 |
* |
19 w/intr |
| |
UAU |
|
|
|
|
18.2 |
|
|
| Sup |
UAG |
None |
|
|
0 |
0.0 |
|
|
| |
UAA |
None |
|
|
0 |
0.0 |
|
|
|
Figure 3.1:
tRNA gene copy number versus codon frequency.
tRNA copy number is the count of each tRNA divided by the 571 total
tRNAs in the genome (pseudogenes not included). Frequency of codons
is the frequency of all codons expected to be decoded by a given tRNA.
Initiator methionine and start codons are not included in counts. See
Table 3.5 for anticodon labels to data
points.
 |
Table 3.5:
tRNA Gene Copy Number Versus Decoded Codon Frequencies.
|
|
tRNA Gene Copy |
Frequency of |
| [0pt]Anticodon |
Number (%) |
Codons (%) |
| UGA |
5.604 |
2.590 |
| UCC |
5.429 |
3.140 |
| CUU |
|
2.550 |
| GUC |
4.729 |
5.230 |
| CUC |
4.028 |
2.320 |
| IGC |
3.853 |
3.430 |
| AAU |
3.678 |
5.230 |
| GUU |
3.503 |
4.970 |
| ICG |
3.327 |
1.590 |
| IAG |
|
3.610 |
| GUA |
|
3.220 |
| UUG |
3.152 |
2.720 |
| IAC |
|
3.800 |
| GUG |
|
2.320 |
| UUC |
2.977 |
4.090 |
| IGU |
|
2.980 |
| UUU |
2.627 |
3.890 |
| IAC |
|
2.780 |
| GCC |
2.277 |
1.740 |
| GCA |
|
2.070 |
| GAA |
|
4.970 |
| UGU |
2.102 |
2.030 |
| UCG |
1.751 |
1.160 |
| CCA |
|
1.110 |
| CAU |
1.576 |
2.390 |
| UGC |
1.401 |
2.010 |
| GCU |
|
0.810 |
| UGA |
1.226 |
2.070 |
| UCU |
|
1.560 |
| UAU |
|
1.010 |
| CGU |
|
0.850 |
| CAA |
|
2.040 |
| IGG |
1.051 |
1.350 |
| CUG |
|
1.360 |
| CGA |
|
1.150 |
| CAG |
|
1.180 |
| UAC |
0.876 |
1.030 |
| CAC |
|
1.410 |
| UAA |
0.701 |
1.050 |
| CGG |
|
0.900 |
| CGC |
|
0.780 |
| CCU |
|
0.380 |
| UAG |
0.525 |
0.810 |
| CCC |
|
0.440 |
| CCG |
0.175 |
0.440 |
| UCA |
|
0.001 |
|
Figure 3.2:
tRNA-like pseudogenes with TTG (Gln) ``anticodons''.
The first sequence is a ``legitimate'' Gln-TTG tRNA, followed by an
alignment of 12 tRNA pseudogenes with TTG in their anticodon
positions. Below sequence alignments are corresponding secondary
structure predictions and bounds from tRNAscan-SE. Nested ``>'' and ``<''
denote base pairings. Right three columns of scores indicate: a)
overall tRNA score, b) primary sequence score, c) secondary structure
score (in bits). Note loss of pairing potential in pseudogenes, and
low secondary structure scores relative to true Gln-TTG tRNA.
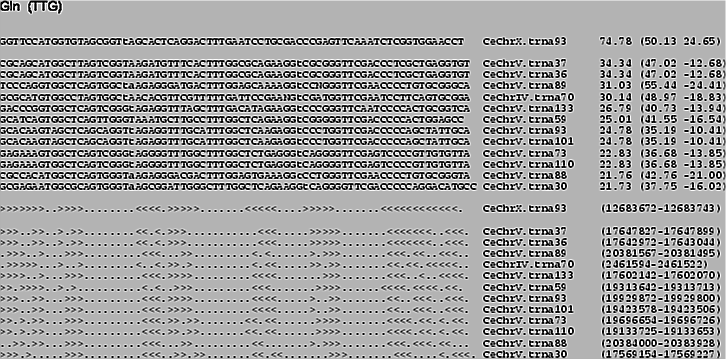 |
Figure 3.3:
tRNA-like pseudogenes with ATG (His) ``anticodons''.
Alignment of 30 tRNA pseudogenes with ATG in their anticodon
positions. Below sequence alignments are corresponding secondary
structure predictions for 15 pseudogenes from tRNAscan-SE. Nested
``>'' and ``<'' denote base pairings. No ``legitimate'' tRNAs
with ATG anticodons were found in the C. elegans genome.
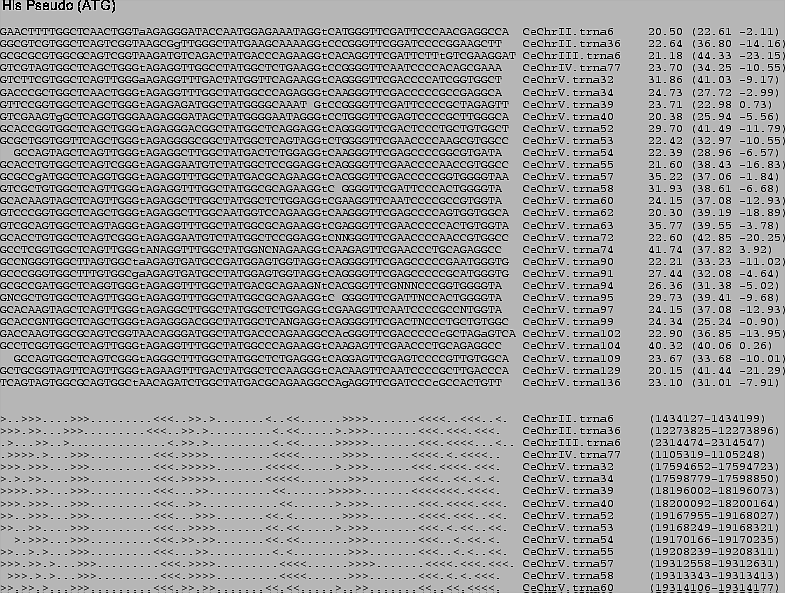 |
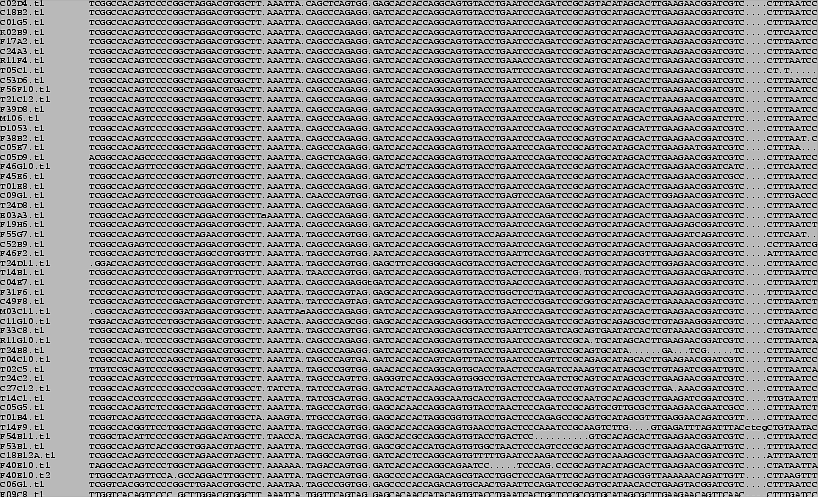
Figure 3.4:
C. elegans tRNA-derived SINE element alignment (5' half).
Alignment of 52 out of >200 genomic copies of tRNA-derived SINE-like
element. The first 74 nucleotides of these elements were detected by
tRNAscan-SE as tRNA-like with strong pol-III promoters, but poor tRNA
secondary structure.
 |
Figure 3.5:
C. elegans tRNA-derived SINE element alignment (3' half).
 |
Next: A Computational Screen for Yeast.2
Up: Analysis of the Genomic
Previous: A tRNA-derived SINE
Todd M. Lowe
2000-03-31