Noam's 161 Final Project: Oil and Politics Info Graphic
backgroud
Information graphics are meant to reveal relationships between data sets. By doing so they help us understand the influences of various factors in our calculations or analysis. While generally this is applied to purely economic or scientific data, it can be useful to chart the effect of political trends on other factors...especially when these effects have been intentionally concealed.
The Oil Connection
In this example, I wanted to chart the effect of political events on gasoline prices. It is often remarked cynically that gas prices tend to fall just before elections, and then slowly rise again afterwards. Politicians claim no relation between the two, but I though it would be interesting to look at the data and see if a strong correlation is noticeable.
Implementation
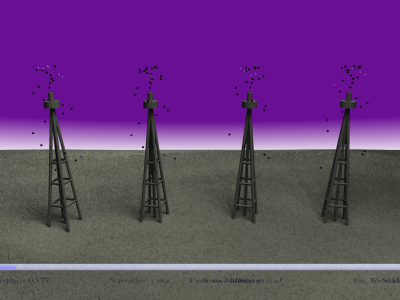
I set up a scene in which four oil derrecks stand in a field. They each represent US regions: East Coast, Midwest, Rocky Mountains and the West Coast. Over time, the spouts rise and fall according to the price of gasoline on a given week. In the background, the sky shifts between red and blue, based on the percentage of Democrats and Republicans in Congress at the time. Future enghancements would feature election timers for both congress and the president, showing where we are in the election cycle. A timeline at the bottom is annotated with some significant current events, to give a fuller picture of the political climate.
Movie clip
Behold the awesomeness, fools
Technical Stuff
So far, the finished product is a non-interactive animation based on a few datasets, rendered with the MegaPOV raytracer. Unlike programs like Maya and 3DStudioMax, MegaPOV uses an internal Scene Description Language, making its use much closer to programming than Photoshop. MegaPOV has file i/o capabilities, as well as advanced CSG functions, a wide array of primitives and offers radiosity and photon mapping options.
Two separate files get imported into the scene for data: a list of Congress percentages, and a list of gas prices for the four regions studied. The percentages of Democrat and Republican Congresspeople determine the blue and red levels of the sky color, respecively. The gas prices, originally given in cents/gallon, are divided by 100 and added to the Y (upwards) component of the velocity vector for each particle. Time calculations assumed that two frames = 1 day, weeks and years are calculated off of that.
Issues
- Particles are used instead of fluid dynamics simulation. Implementing fluids would mean either spending a lot of money or trying to develope my own version, which would be a whole other project.
- Pairing of particles to black spheres needs tweaking.
- No election timers yet.
- Timeline and event markers need adjustment, mostly just a matter of tweaking the increment variable.
- Available online gas pricing data only goes back to 1992.
The biggest improvement that could be made to this project would be to make it interactive. At the moment, it's a pre-rendered movie file. Implementing the simulation in openGL would enable all kinds of cool stuff. The wish list:
- Load different data files
- change view (trivial but fun), zooming
- adjust vertical scale of spouts
- change number of derrecks to represent different regions or cities, general tweakage of what data is displayed
- CFD for better effect
Source code
the .pov file, plus the two data files, are available here.
Here are some links to my sources: