TREEMAP USENET VISUALIZATION TOOL
Objective:
The idea of the project is to visualize the activity in a newsgroup by means of treemap visualization.
Description:
The details regarding newsgroups are gathered, and a criterion is chosen to use the visualization criterion.
For this treemap visualization technique, we have used the number of
messages posted to the newsgroup as the input weight criterion.
Screenshot:
A screenshot of the application is shown below.
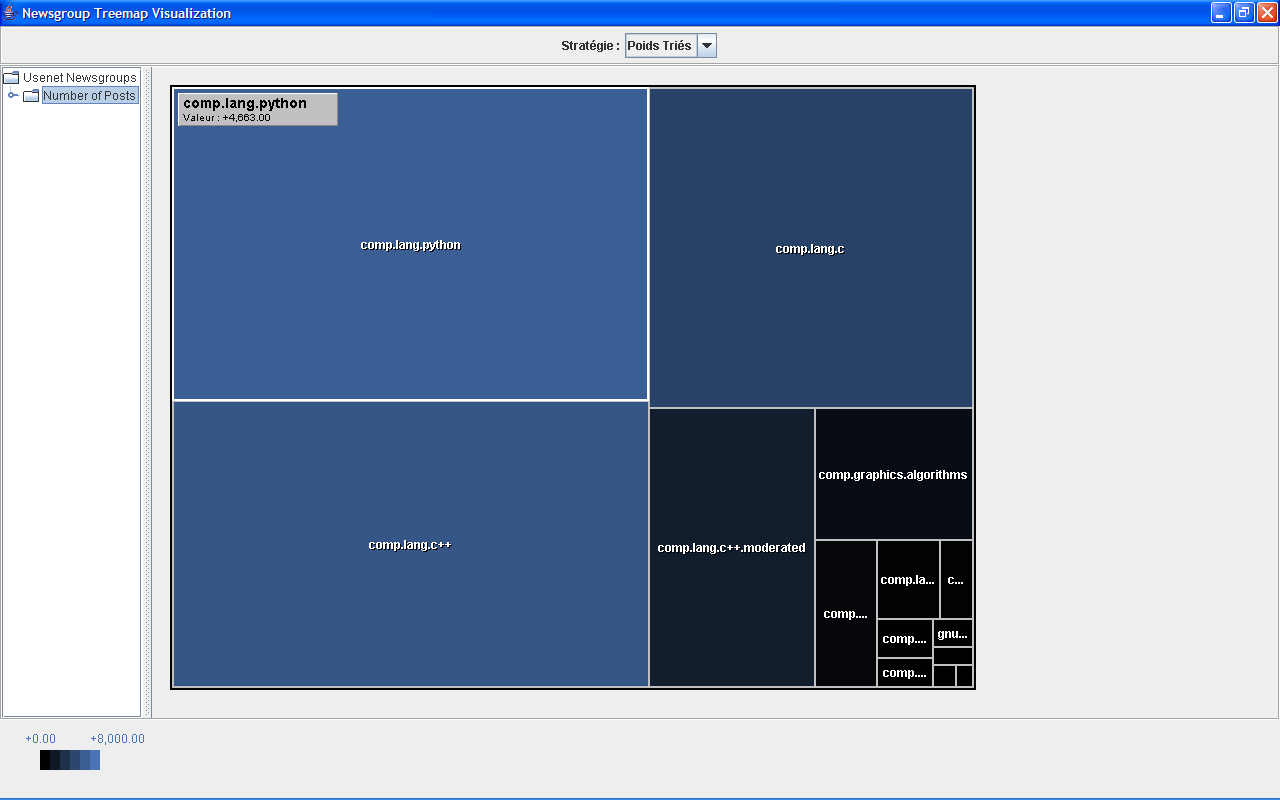
Figure 1: This shows the visualization of the newsgroup color coded between black and bluish violet color as shown above
Implementation:
The details regarding the newsgroups are gathered by means of a Python script, that establishes contact with the
news server and gathers information regarding a set of pre-specified newsgroups. The results are written to a XML file.
A typical XML looks as follows.
<?xml version="1.0" ?>
<root><libelle>Usenet Newsgroups</libelle>
<branche>
<libelle>Number of Posts</libelle>
<item><libelle>comp.lang.c</libelle><poids>3238</poids><valeur>3238</valeur></item>
<item><libelle>comp.lang.c++</libelle><poids>4234</poids><valeur>4234</valeur></item>
<item><libelle>comp.lang.python</libelle><poids>4663</poids><valeur>4663</valeur></item>
<item><libelle>comp.lang.c.moderated</libelle><poids>69</poids><valeur>69</valeur></item>
<item><libelle>comp.lang.c++.moderated</libelle><poids>1442</poids><valeur>1442</valeur></item>
<item><libelle>gnu.gcc.help</libelle><poids>35</poids><valeur>35</valeur></item>
<item><libelle>gnu.g++.help</libelle><poids>22</poids><valeur>22</valeur></item>
<item><libelle>comp.lang.java.machine</libelle><poids>11</poids><valeur>11</valeur></item>
<item><libelle>comp.lang.java.softwaretools</libelle><poids>155</poids><valeur>155</valeur></item>
<item><libelle>comp.ai</libelle><poids>79</poids><valeur>79</valeur></item>
<item><libelle>comp.compression</libelle><poids>284</poids><valeur>284</valeur></item>
<item><libelle>comp.graphics.algorithms</libelle><poids>648</poids><valeur>648</valeur></item>
<item><libelle>comp.graphics.animation</libelle><poids>49</poids><valeur>49</valeur></item>
<item><libelle>comp.graphics.visualization</libelle><poids>15</poids><valeur>15</valeur></item>
</branche>
</root>
The XML file mentioned above follows the format as required by the JTreemap software tool [1] .
The color coding scheme is implemented as follows.
The weight of the newsgroup ( number of messages in this case) is normalized between 0.0 and 1.0 for all the newsgroups.
The normalized value is used as index of the value component in the HSV color model , with the hue and saturation set constant.
In Java, this could be implemented as :
Color.getHSBColor(DEFAULT_HUE, DEFAULT_SATURATION, value);
as part of the java.awt.Color API .
Build:
The application has two modules, visualization tool
written in Java (Swing) and the statistics module written in python.
The sources are available here.
Typical steps include as follows.
$ python genxml.py
This script makes connection with the relevant
newsgroup server and collects statistics for a predefined set of
newsgroups,
and writes the same to output.xml .
To build the java program, invoke as follows.
$ ant
This builds the program.
$ java -classpath bin;jdom.jar com.jense.treemap.example.TreeMap go.xml
This launches the GUI of the visualization . The Java program visualization is based on
the original tool available here , JTreeMap [1] .
Acknowledgements:
1. JTreeMap - http://jtreemap.sourceforge.net .