Year total data
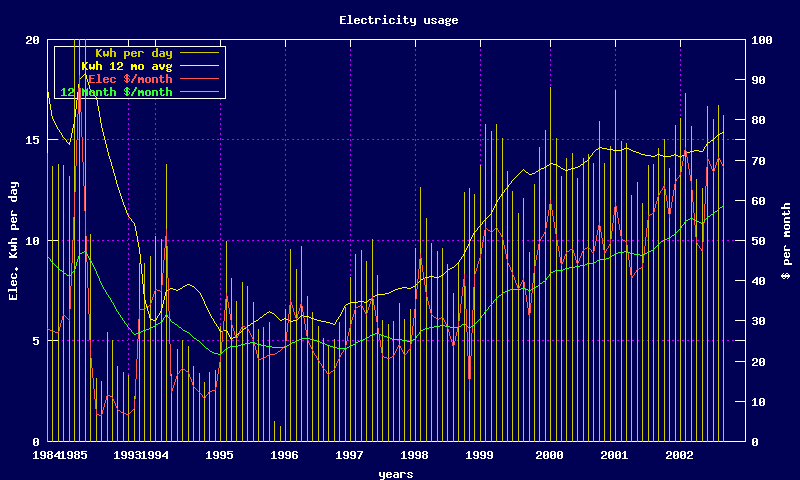
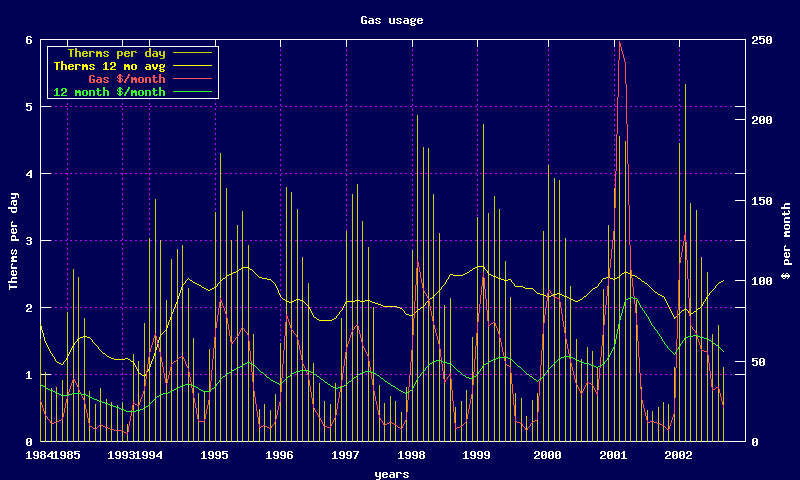
Year DaysTherms  Kwh    $ Gas   $ Elec $ Taxes  $ Total T/day  Kwh/day $/day
2002  185  680  2820   499.59   376.52   61.89   938.00   3.7     15.2  5.07
2001  364  671  5189   906.97   643.72  126.97  1677.66   1.8     14.3  4.61
2000  365  894  5297   721.25   587.81    6.15  1315.21   2.4     14.5  3.60
1999  366  801  4997   540.64   551.74   77.43  1169.81   2.2     13.7  3.20
1998  364  950  3915   638.45   394.74  110.74  1143.93   2.6     10.8  3.14
1997  370  697  2872   425.54   334.43    9.80   769.77   1.9      7.8  2.08
1996  362  756  2496   460.89   291.06  -15.50   736.45   2.1      6.9  2.03
1995  366  796  2235   533.55   307.00   59.36   899.91   2.2      6.1  2.46
1994  342  786  1879   479.56   227.76   47.96   755.28   2.3      5.5  2.21
1993  124  219  1123   131.54   136.75   16.50   284.79   1.8      9.1  2.30
1985  271  319  2632   145.06   219.16   -0.31   363.91   1.2      9.7  1.34
1984  208  262  3308   135.61   242.04    4.30   381.95   1.3     15.9  1.84